Latest posts
-
EUR/USD: Why the rate differential still sets the ceiling on any euro rally
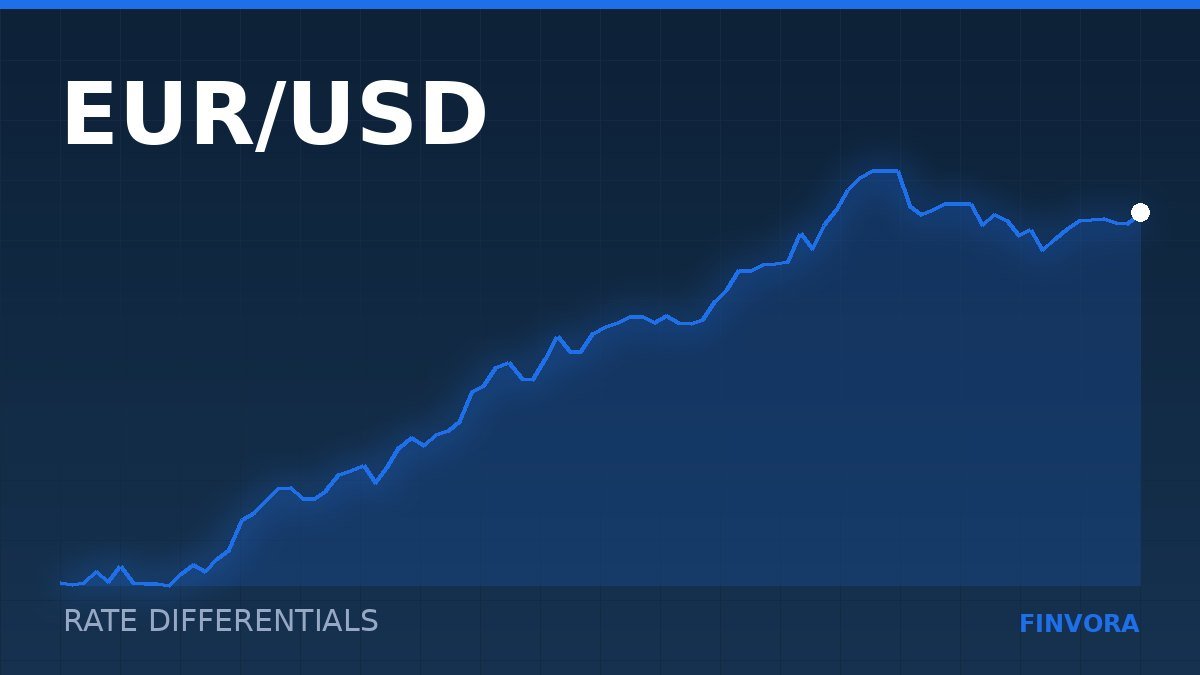
Every euro rally of the past two years has run into the same wall: the spread between what the market expects from the Fed and what it expects from the ECB. Here is how to read that spread on a chart.
-
USD/JPY: the carry trade explained properly, and why it unwinds so violently
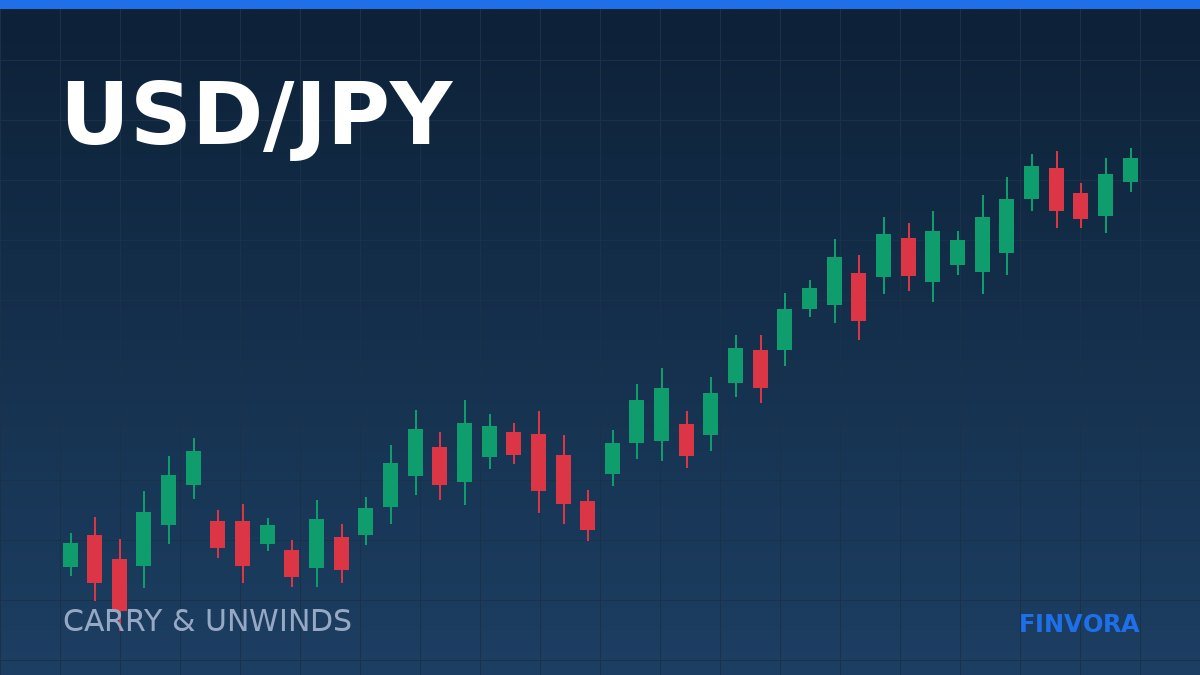
The yen carry trade earns slowly and loses quickly. Understanding the asymmetry is the difference between riding the trend and being the liquidity for someone else’s exit.
-
GBP/USD: sterling trades on two curves, and traders usually watch the wrong one
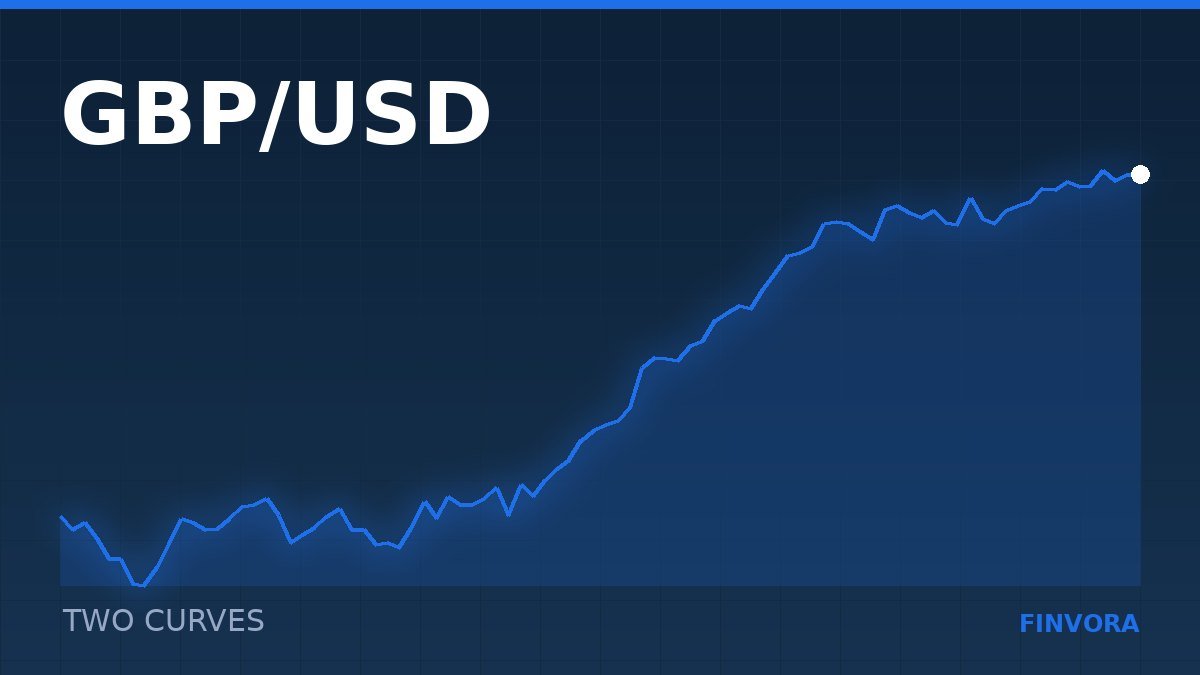
Sterling behaves like a rates currency on quiet days and a risk currency on loud ones. Knowing which regime you are in determines whether the chart level in front of you means anything.
-
Support and resistance: what these levels actually are, and why most of them are imaginary
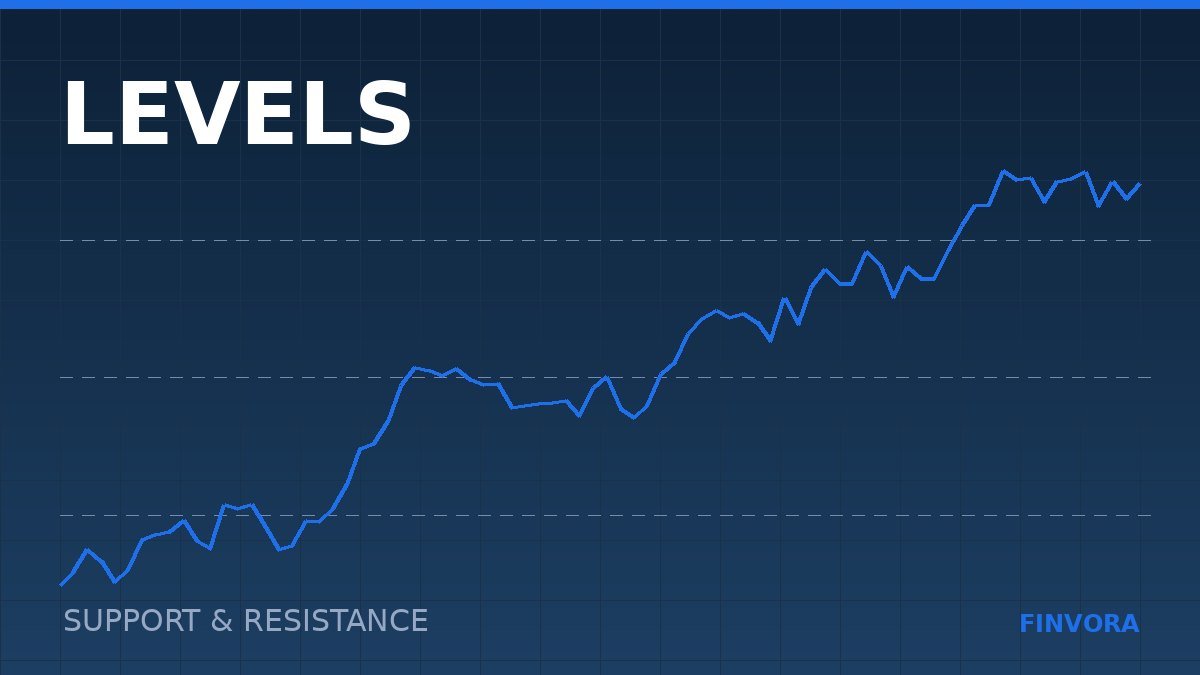
A level is not a magic number. It is a record of where large amounts of business were transacted — and that distinction tells you which lines on your chart are worth trading and which are decoration.
-
Trading the London and New York overlap: the four hours that make the day
Roughly 12:00 to 16:00 GMT is when depth peaks, spreads tighten and most daily ranges are completed. Here is how to structure a session around it.