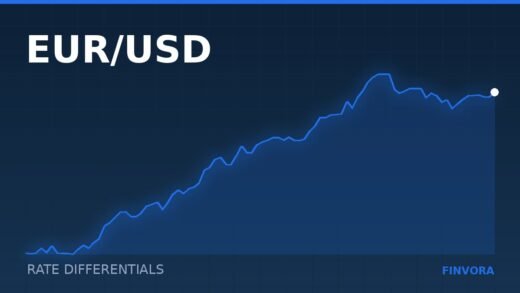
EUR/USD: Why the rate differential still sets the ceiling on any euro rally
Every euro rally of the past two years has run into the same wall: the spread between what the market…
Price a trade before you take it: what it returns if it works, and what it costs if the stop is hit.
Run both sides of the trade through this before entering. A setup that returns less at its target than it costs at its stop is not a trade worth taking, however good the chart looks.
Check what a trade is worth before you take it, and what the same trade costs if the stop is hit.
The figure ignores spread, commission and overnight swap. Real results are always worse than the arithmetic, and the gap widens the more often you trade.
The output ignores spread, commission and overnight swap. Those costs are small on any single trade and decisive across a year of them, and they fall hardest on short-holding-period strategies. If a system only works before costs, it does not work.
Run the calculator twice – once to your target, once to your stop – and compare. The ratio matters less than people claim in isolation, because a strategy hitting a two-to-one target four times in ten is worse than one hitting a one-to-one target seven times in ten. What matters is the ratio together with how often the trade actually reaches the target.
Every euro rally of the past two years has run into the same wall: the spread between what the market…
Real yields, official-sector buying and the dollar do most of the work in gold. Inflation headlines, despite the folklore, do…
The halving cycle shaped every previous Bitcoin bull market. With regulated funds now setting the marginal bid, the framework needs…
The rate decision is rarely the news. The market trades the changed adjectives, the vote split and the projections —…