EUR/USD: Why the rate differential still sets the ceiling on any euro rally
Every euro rally of the past two years has run into the same wall: the spread between what the market expects from the Fed and what it expects from the ECB. Here is how to read that spread on a chart.
Key takeaways
- – The two-year yield spread between Germany and the United States has been the single most reliable anchor for EUR/USD direction
- – Rallies that are not confirmed by a narrowing spread have consistently faded inside two weeks
- – Positioning matters at extremes: crowded shorts turn ordinary data into outsized squeezes
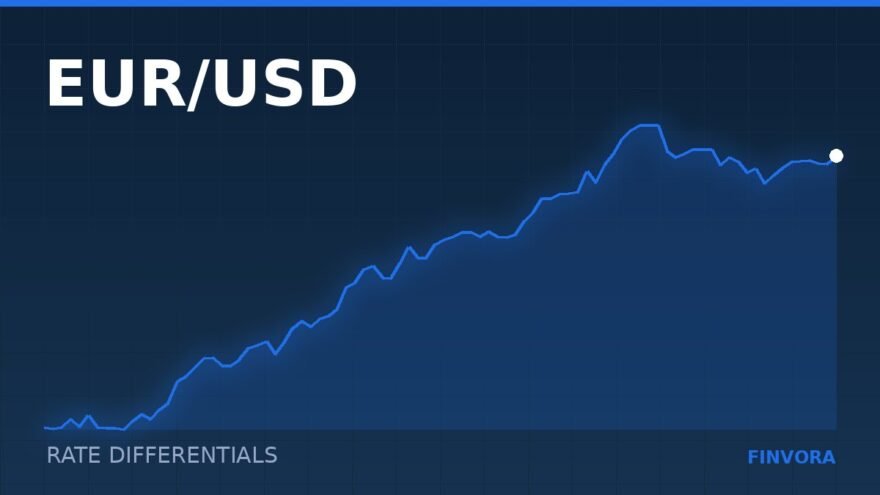
If you strip EUR/USD back to one driver, it is the relative price of money. The euro is not bought because Europe is growing well; it is bought when the market decides the European Central Bank will be less generous, or the Federal Reserve more generous, than previously assumed. That relative repricing shows up first in the two-year yield spread between German Schatz and US Treasuries, and only afterwards in spot.
Read the spread before you read the chart
The mechanic is straightforward. Two-year yields are the cleanest market expression of where each central bank will be a couple of years out. When the German two-year rises relative to the US two-year, holding euros becomes more attractive on a carry-adjusted basis and EUR/USD tends to follow. When the spread widens in the dollar’s favour, the euro struggles no matter how constructive the chart looks.
The practical test is simple. Before you take a euro long, check whether the spread is moving in your direction. A rally in spot that is not accompanied by a narrowing spread is usually a positioning event — a squeeze, a rebalancing flow, an options expiry — and those decay.
What the chart adds
Technical structure does not replace the macro anchor, but it tells you where the market has already agreed on value. Three things are worth marking on a daily EUR/USD chart:
- The 200-day moving average. Not as a signal, but as a rough dividing line between regimes. Rallies that stall beneath it repeatedly tend to be corrections inside a downtrend.
- Prior consolidation shelves. Areas where the pair spent several weeks going nowhere are where resting orders accumulate. They matter more than a single spike high.
- The weekly range. A pair that closes the week outside its previous four-week range has usually had a genuine repricing rather than noise.
The positioning trap
Rate differentials explain direction; positioning explains violence. When speculative accounts are heavily short the euro, the pair stops responding proportionally to bad European news and starts responding sharply to anything mildly good. That asymmetry is not a reason to be long, but it is a reason to size smaller and to place stops outside obvious clusters. Crowded trades do not reverse trends — they interrupt them, expensively.
How to frame a trade
A workable structure looks like this: define the macro bias from the spread, define the level from the chart, and define invalidation from volatility rather than from hope. If the average true range on the daily is around 60 pips, a 25-pip stop is not a tight risk plan, it is a donation. Either widen the stop and cut the size, or wait for a level that lets you do both.
What would change the picture
Three developments would genuinely alter the euro’s medium-term path rather than just moving it around: a sustained repricing of ECB policy expectations relative to the Fed, a durable improvement in the euro area growth impulse that shows up in forward-looking surveys, and a change in the energy import bill that shifts the region’s terms of trade. Watch the interactive chart below alongside the calendar and treat everything else as noise until one of those three moves.
Track the pair against its peers on the cross rates and heat map page, and check the economic calendar before every European and US session.